


Leader in Digital Intelligence
Effective data visualization is crucial for uncovering key insights in complex investigations. Penlink’s advanced mapping tools allow you to layer, customize, and analyze data with precision, offering a clear, visual representation that supports your case. From multi-layered maps to courtroom-ready presentations, our platform empowers you to present data in an intuitive, impactful way—helping you build a strong, provable case every time.
Advanced Mapping and Visualization to Support Your Case
You need a tool to help you understand your subject and gain insights—and one that clearly documents it all for an airtight case. With Penlink’s mapping and visualization capabilities, you can see the full picture in an easy-to-follow methodology.
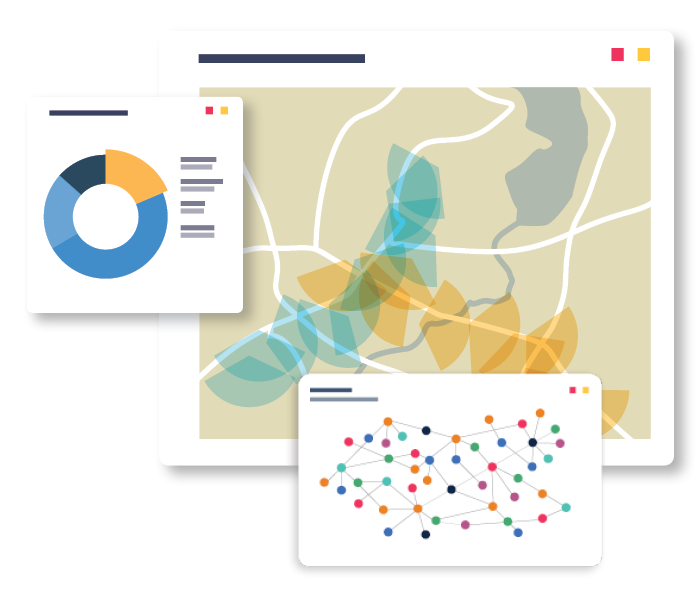
Layer Your Data for Comprehensive Analysis
Our platform is equipped with advanced mapping and data visualization capabilities, and the tools you need to layer your data for a compelling and provable timeline. Boost your mapping capabilities by leveraging our latest features including 3D mapping and geo-temporal visualization.
Leverage Customizable Maps
Our platform provides you with the tools you need for customizable maps in every investigation. Color-code target profiles, hide or display targets or locations, showcase distances, customize cell sectors, and add points of interest for crime-scenes and more.
See Your Data More Clearly
Our platform gives you the ability to plot all your data types on one map, including GPS locations, cell sector usage, tower frequencies, RTT, location pings, IP addresses, web locations, and images with EXIF data.
Powerful Mapping and Data Visualization Tools
Penlink delivers state-of-the-art 3D mapping and data visualization tools designed to accelerate investigations and boost your agency’s clearance rate. Effortlessly analyze, map, combine, visualize, and share your case data with precision and speed.
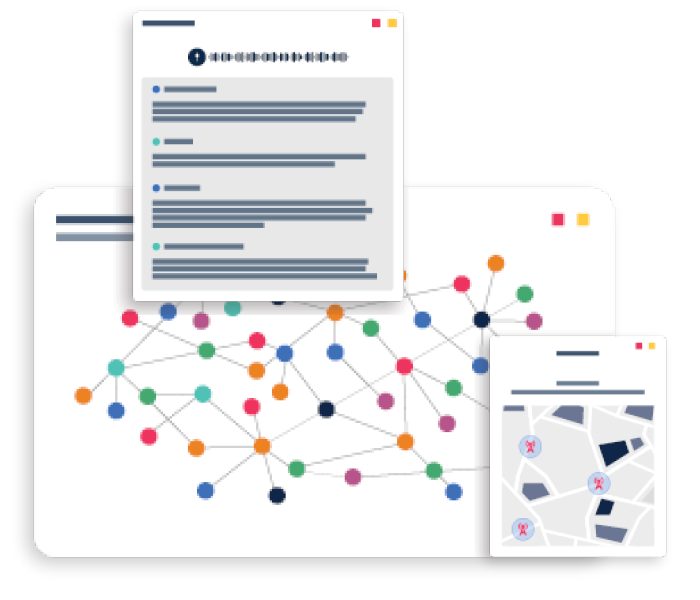
Comprehensive Visual Link Analysis
Our Visual Link Analysis tool reveals complex data relationships through interactive link maps, helping users uncover hidden connections and patterns for better decision-making.

Comprehensive Visual Link Analysis
Our Visual Link Analysis tool reveals complex data relationships through interactive link maps, helping users uncover hidden connections and patterns for better decision-making.
Advanced Geolocation Capabilities
Pinpoint exact data locations in real time with our Advanced Geolocation Capabilities, facilitating geospatial analyses, entities tracking, cross analysis, and critical insights.

3D Data Visualizations and Mapping
Leverage 3D mapping to fill gaps in your data and produce needed evidence. Produce easy-to-understand visuals to confidently show where your suspect’s device was during critical times, and enable high-impact courtroom presentations
Represent Your Data Accurately
Accurately representing your data is essential in court, and Penlink’s visualization and presentation capabilities can help you drive your point home for jurors and judges alike.
| Feature | Description |
|---|---|
| Comprehensive Data Utilization | Easily drag-and-drop your data for instant cleaning, mapping, and analysis. Import and layer data from multiple sources, including CDRs, mobile forensics, web data, and more. |
| Multi-Layered Maps | Create complex, multi-layered maps that combine various data sources to provide a comprehensive view of the case. |
| Visual Link Analysis | Utilize advanced visual link analysis to uncover relationships and patterns between entities, helping to identify key connections. |
| 3D Mapping for Evidence Gaps | Use a 3D mapping tool to show time and space, uncover hidden details, and identify key activities, locations, and relationships. |
| Intuitive Courtroom Maps | Present data effectively in the courtroom with easy-to-understand visuals. Export automatic reports with one click to create high-impact presentations. |
Resources

Amazon Data for Law Enforcement: Interpreting the Returns, Case Strategies, and Legal Insights
This session will delve into the intricate world of Amazon data and its critical role in solving complex crimes.
Explore >
Case Study Webinar: How CDR Analysis and OSINT Assisted in an Online Exploitation Investigation
Join Randal Gilliland from PenLink and Scott Gilliam from the University of Alabama Police Department for an exciting case study on how PenLink’s cutting-edge digital intelligence tools—PLX and Tangles—played a pivotal role in their investigation.
Explore >Innovative Technology
Utilize state-of-the-art AI and analytics to stay ahead of emerging threats. Experience unparalleled precision and efficiency in your intelligence operations.
ExploreTrusted Expertise
Rely on the expertise trusted by global governments and enterprises. Penlink is your partner in safeguarding critical missions and enhancing decision-making.
Explore